|
|
|
O Labor Force Participation by Gender XXGates
|
|
|
|
 | Labour force participation by Gender
|
|
|
|
|
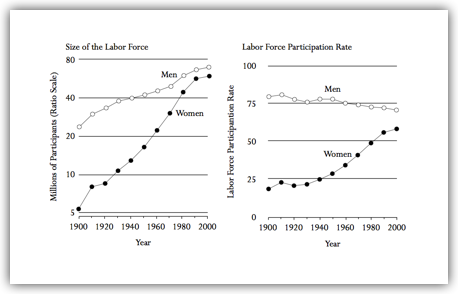
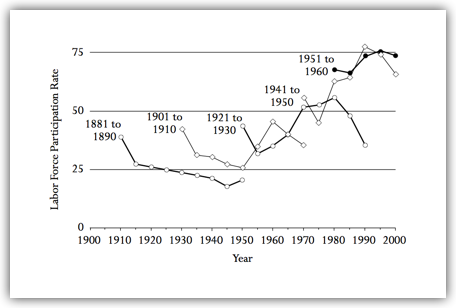
 | TIME SERIES The Civilian Workforce and Labor Force Participation Rate, by Gender, 1900 to 2000,USA - Fischer and Hout (2008)
|
|
|
|
|
| The source of the data is the 'Integrated Public Use Microdata Series' (IPUMS).
Note: Questions about employment status were not asked of persons under fourteen years old prior to 1940, nor of persons under sixteen years old from 1940 onwards.
|
|
|
|
|
| TABLE The share of females in non-agricultural employment (1880-1910) - Cambridge Economic History Vol. 2
|
|
|
|
|
| Taken from: The Cambridge Economic History of Modern Europe: Volume 2, 1870 to the Present
The share of females in non-agricultural employment
|
|
1880
|
1900
|
1910
|
Deviating year
|
Ireland
|
47.9
|
–
|
40.8
|
1881, 1901, 1911
|
Britain
|
33.8
|
31.5
|
31.6
|
Belgium
|
33.0
|
29.3
|
32.1
|
|
Netherlands
|
25.1
|
26.4
|
26.3
|
1889, 1899, 1909
|
France
|
34.4
|
37.4
|
36.2
|
1886, 1901, 1911
|
Germany
|
18.3
|
20.1
|
21.5
|
1882, 1895, 1907
|
Switzerland
|
26.4
|
34.4
|
38.6
|
1890
|
Austria
|
35.4
|
29.4
|
31.4
|
|
Hungary
|
34.6
|
29.0
|
27.1
|
|
Italy
|
42.5
|
31.7
|
29.4
|
|
Spain
|
24.5
|
23.6
|
20.0
|
1877
|
Portugal
|
40.1
|
20.9
|
33.3
|
1890, 1911
|
Denmark
|
50.4
|
35.0
|
38.3
|
|
Norway
|
40.0
|
40.2
|
40.5
|
1875
|
Russia
|
|
18
|
27
|
1914
|
Sweden
|
17.9
|
29.4
|
30.3
|
|
Finland
|
31.3
|
31.7
|
35.9
|
|
Europe, this sample
|
32.1
|
29.7
|
29.7
|
As above
|
- excl. Italy
|
30.3
|
29.5
|
29.8
|
Source: Calculated from Mitchell 2003. Decrease by at least one percentage point in italics. For Russia, Barber and Davies 1994, p. 92.
|
|
|
|
|
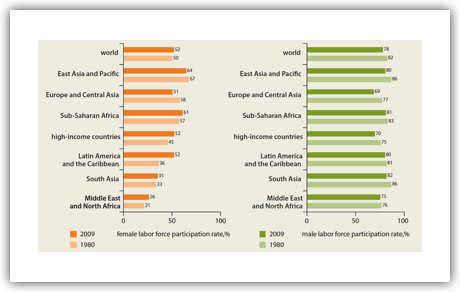
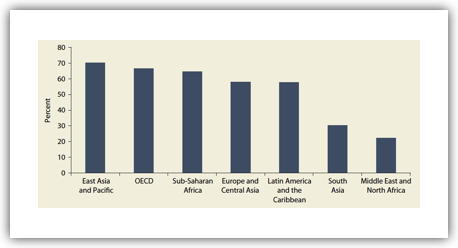
| BARCHART-through-TIME Closing the access gap—Recent advances in female labor force participation, by world region (1980 & 2009) – World Development Report 2012
|
|
|
|
|
| Source: World Development Indicators 2011.
|
|
|
|
|
| The material in this publication is copyrighted. Copying and/or transmitting portions or all of this work without permission may be a violation of applicable law. The International Bank for Reconstruction and Development / The World Bank encourages dissemination of its work
and will normally grant permission to reproduce portions of the work promptly.
For permission to photocopy or reprint any part of this work, please send a request with complete information to the Copyright Clearance Center Inc., 222 Rosewood Drive, Danvers, MA 01923, USA; telephone: 978-750-8400; fax: 978-750-4470; Internet: www.copyright.com.
|
|
|
|
|
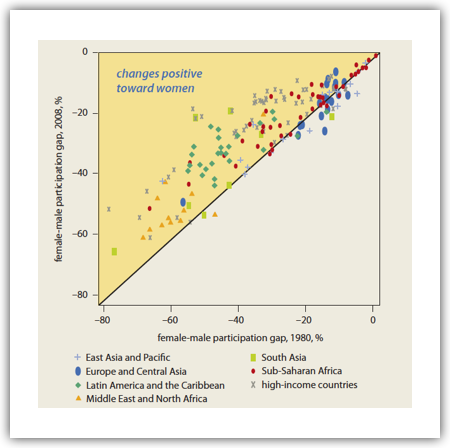
| SCATTER The gender gap in labor force participation narrowed between 1980 and 2008 – World Development Report 2012
|
|
|
|
|
| Source: WDR 2012 team estimates based on International Labour Organization 2010.
Note: The 45° line in the fi gure above shows parity in the values on the vertical and horizontal axis.
|
|
|
|
|
| The material in this publication is copyrighted. Copying and/or transmitting portions or all of this work without permission may be a violation of applicable law. The International Bank for Reconstruction and Development / The World Bank encourages dissemination of its work
and will normally grant permission to reproduce portions of the work promptly.
For permission to photocopy or reprint any part of this work, please send a request with complete information to the Copyright Clearance Center Inc., 222 Rosewood Drive, Danvers, MA 01923, USA; telephone: 978-750-8400; fax: 978-750-4470; Internet: www.copyright.com.
|
|
|
|
|
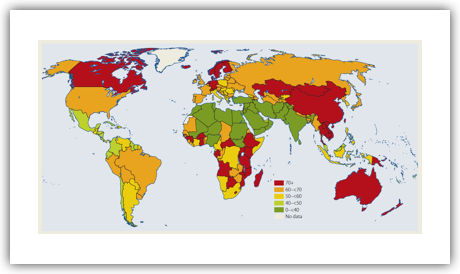
| WORLDMAP World Map of Female labor force participation – World Development Report 2012
|
|
|
|
|
| Source: International Labor Organization (2010a).
|
|
|
|
|
| The material in this publication is copyrighted. Copying and/or transmitting portions or all of this work without permission may be a violation of applicable law. The International Bank for Reconstruction and Development / The World Bank encourages dissemination of its work
and will normally grant permission to reproduce portions of the work promptly.
For permission to photocopy or reprint any part of this work, please send a request with complete information to the Copyright Clearance Center Inc., 222 Rosewood Drive, Danvers, MA 01923, USA; telephone: 978-750-8400; fax: 978-750-4470; Internet: www.copyright.com.
|
|
|
|
|
| BARCHART Percentage of females in the labor force, by world region – World Development Report (2014) R√
|
|
|
|
|
| Source: WDR 2014 team based on data from World Bank World Development Indicators (database).
Note: Data are as of 2011. Organisation for Economic Co-operation and Development (OECD) countries in the figure are high-income
countries that have been members of the OECD for at least 40 years. All other countries are grouped into geographic regions.
|
|
|
|
|
|
This work is available under the Creative Commons Attribution 3.0 Unported license (CC BY 3.0) http://creativecommons.org/licenses/ by/3.0. Under the Creative Commons Attribution license, you are free to copy, distribute, transmit, and adapt this work, including for com- mercial purposes, under the following conditions:
Attribution—Please cite the work as follows: World Bank. 2013. World Development Report 2014: Risk and Opportunity—Managing Risk for Development. Washington, DC: World Bank. doi: 10.1596/978-0-8213-9903–3. License: Creative Commons Attribution CC BY 3.0
Translations—If you create a translation of this work, please add the following disclaimer along with the attribution: This translation was not created by The World Bank and should not be considered an official World Bank translation. The World Bank shall not be liable for any content or error in this translation.
|
|
|
|
|
| Statistik zu Employment Rate Gender Gap – The Economist
|
|
|
|
|
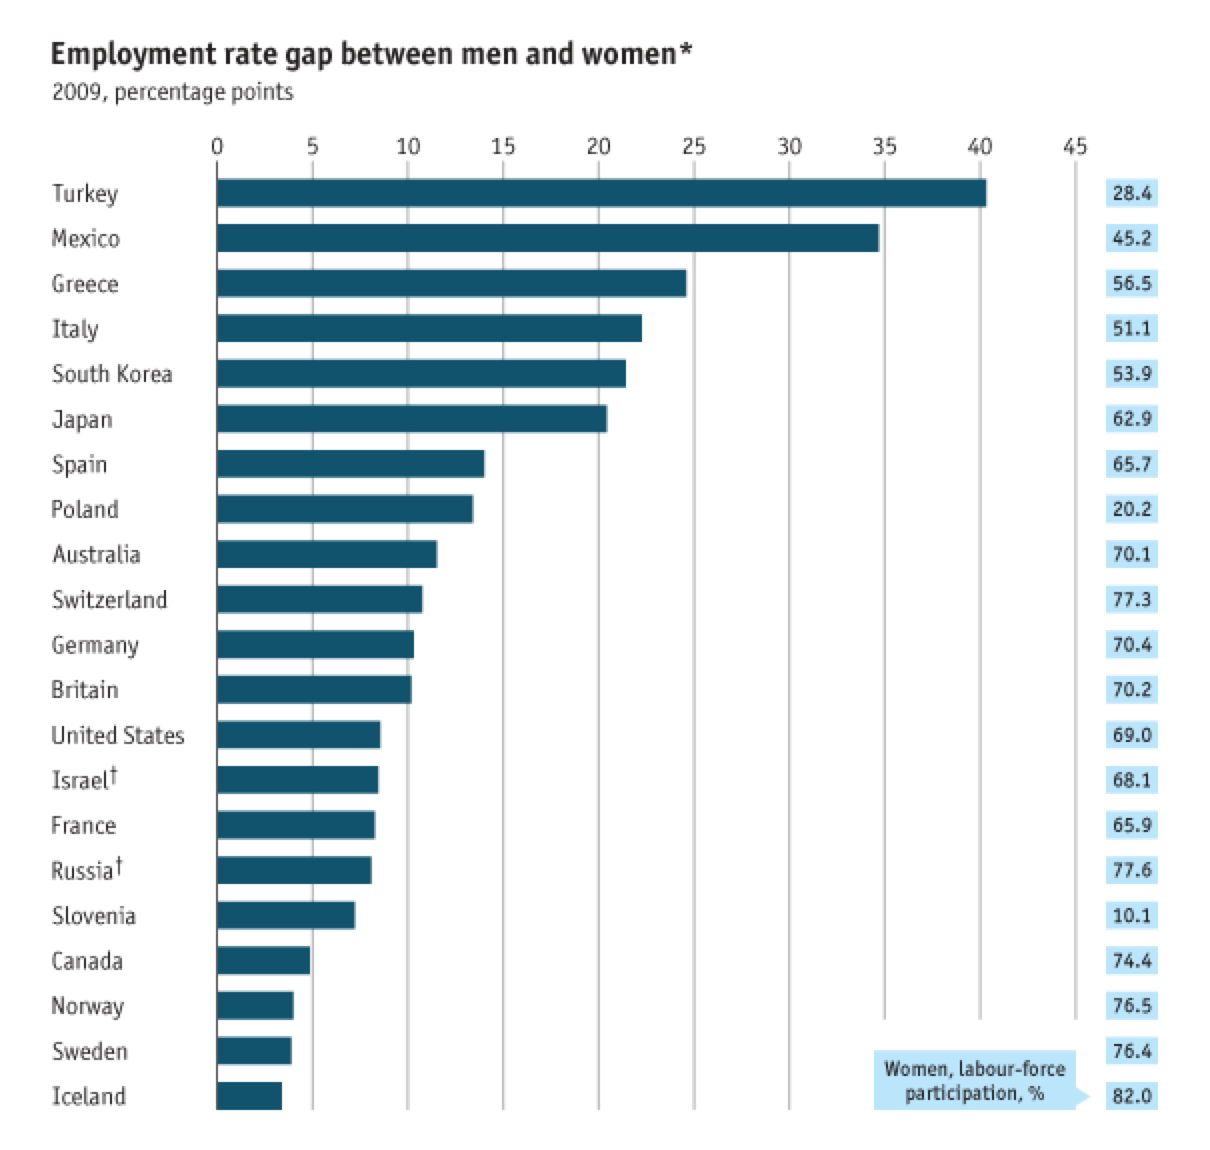
| In skandinavischen Ländern unter 5%, in restlichen westlichen zwischen 5 und 15% und sonst höher: Employment Rate Gap Between Men and Women (2011 Country Cross Section) - Women: A work never done | The Economist
|
|
|
|
|
|
Employment Rate Gap Between Men and Women (2011 Country Cross Section) - Women: A work never done | The Economist

Dies ist ein Teil des Artikels:
Women
A work never done
Mar 8th 2011, 16:58 by The Economist online
Policies and quotas have helped women in politics and in business. In Norway, women make up nearly 40% of board members of the largest listed companies. Yet on average across Europe they only occupy one in every ten board seats. This may improve, with more women than ever now in the global business-school pipeline. In 2010, nearly 106,000 women sat the GMAT exam, an MBA entrance exam, accounting for over 40% of examinees. In the OECD, a club of mostly rich countries, 61% of women are active in the labour force. But the difference in male and female employment rates in many countries is still large and persistent. While progress has been made, there is a long way to go before gender equality is reached.
◦ 
|
|
|
|
|
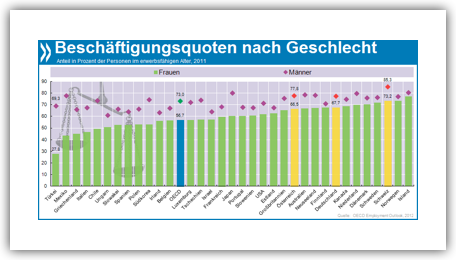
| BARCHART Employment Ratios by Gender - OECD Cross-Section
|
|
|
|
|
| Working Girl: In der Schweiz und den nordischen Ländern verdienen über 70 Prozent der Frauen im erwerbsfähigen Alter ihr eigenes Geld, in der Türkei sind es 28 Prozent.
Mehr unter http://bit.ly/16oBjTX (OECD Factbook 2013, S. 131)
|
|
|
|
|
| TIME SERIES Young Women Were Less Likely to Leave the Labor Force over Time: Labor Force Participation Rate of Women Age Twenty to Sixty-Four, by Year and Cohort, 1910 to 2000,USA - Fischer and Hout (2008)
|
|
|
|
|
| The source of the data is the 'Integrated Public Use Microdata Series' (IPUMS).
Note: The data points for census years are for women in the younger half of the cohort; the data points for years ending with “5” are the rates for women in the older half in the census year.
|
|
|
|
|
| Correlates, Determinants, & Consequences
|
|
|
|
|
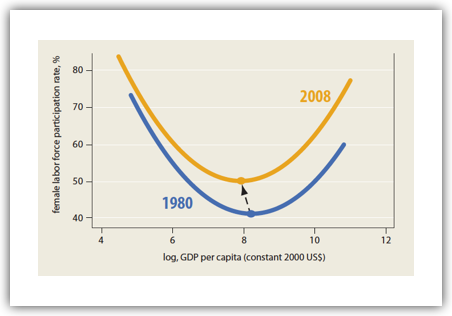
| SCATTER female labour force participation vs. GDP - Female labor force participation has increased over time at all income levels – World Development Report 2012
|
|
|
|
|
| Source: WDR 2012 team calculations based on International Labor Organization 2010 (130 countries).
|
|
|
|
|
| The material in this publication is copyrighted. Copying and/or transmitting portions or all of this work without permission may be a violation of applicable law. The International Bank for Reconstruction and Development / The World Bank encourages dissemination of its work
and will normally grant permission to reproduce portions of the work promptly.
For permission to photocopy or reprint any part of this work, please send a request with complete information to the Copyright Clearance Center Inc., 222 Rosewood Drive, Danvers, MA 01923, USA; telephone: 978-750-8400; fax: 978-750-4470; Internet: www.copyright.com.
|
|
|
|
|
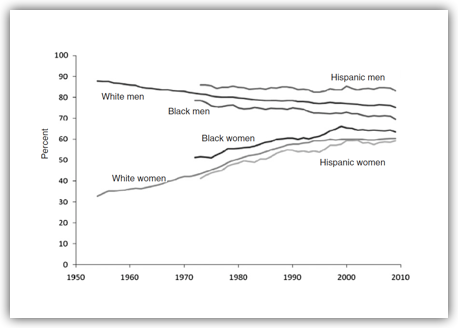
| TIMESERIES Labor force participation rates, 20 years and older, by gender and race – Ashenfelter & Card (2010)
|
|
|
|
|
| (Source: Bureau of Labor Statistics
|
|
|
|
|
| [ref]This is taken from a chapter in Orley Ashenfelter, David Card (2010) - Handbook of Labor Economics. Volume 4A. North-Holland.
[/ref]
|
|
|
|
|
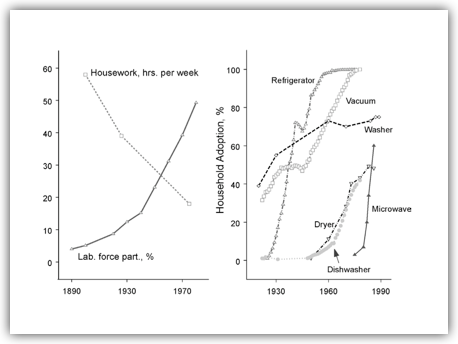
| TIMESERIES Technological progress in the home and female labor-force participation – Aghion & Durlauf [Eds.] (2006)
|
|
|
|
|
| Technological progress in the home
Female labor-force participation. Just as the last 200 years have witnessed techno- logical progress in the market sector, they have witnessed tremendous technological advance in the home sector. Since productivity numbers are not computed for the home sector, given the elusive nature of output and inputs, the evidence on technological progress is circumstantial. The household sector in the American economy was basi- cally a cottage industry until the dawning of the Second Industrial Revolution. With the onset of the electric age a host of new appliances were ushered in: washing machines, refrigerators, etc. It took time for these new capital goods to diffuse through the economy, as Figure 3 shows.4 At the same time, the principles of scientific management were being applied to everyday household tasks. The large table and isolated dresser that characterized a kitchen of the 1800s were replaced by continuous countertops and built-in cabinets. This wave of technological progress in the home freed up tremendous amounts of labor – see Figure 3. The time spent on housework fell from 58 hours per week in 1900 to just 18 in 1975. Married women could now enter the labor force, and they did in droves.
|
|
|
|
|
| [ref]This is taken from a chapter in Philippe Aghion, Steven N. Durlauf (2006) - Handbook of Economic Growth, Volume 1B. North Holland.
[/ref]
|
|
|
|
|
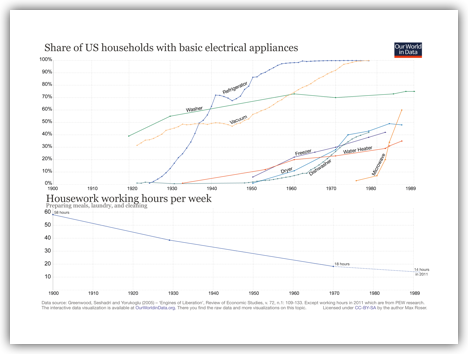
| A while ago I (Max) did this chart. I have never put it on OWID. You could use it here and relate it to the increasing labor force participation of women.
|
|
|
|
 |
|
| Share-of-US-households-with-basic-electrical-appliances-with-working-hours.png
|
|
|
|
|
|
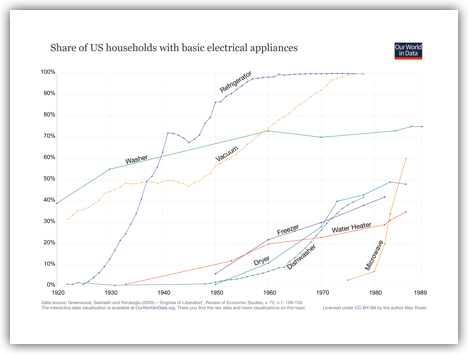
| Share-of-US-households-with-basic-electrical-appliances.png
|
|
|
|
|
| – – – – – – – – – – – – – – – – – – – – – – – – – – – – – – – – – – – – – – – – – – – – – – – – – – – – – – – – –
|
|
|
|
|
| Measurement, Data Quality & Definitions
|
|
|
|
|
| – – – – – – – – – – – – – – – – – – – – – – – – – – – – – – – – – – – – – – – – – – – – – – – – – – – – – – – – –
|
|
|
|
|
| DATA&xls Economically Active Population By Major Activity Groups – International Historical Statistics
|
|
|
|
|
| Generelle Beschreibung der Quelle
|
|
|
|
|
| Data from 1750 onwards for countries around the world is available in the International Historical Statistics (IHS). These statistics – orignally published under the editorial leadership of Brian Mitchell (since 1983) – are a collection of data sets taken from many primary sources, including both official national and international abstracts dating back to 1750. The books are published in three volumes covering more than 5000 pages.[ref]The printed version is published in 3 volumes: Africa, Asia, Oceania – The Americas – Europe. The volume set is described at the publisher's website here. http://www.palgraveconnect.com/pc/doifinder/10.1057/9781137305688[/ref] At some universities you can access the online version of the books where data tables can be downloaded as ePDFs and Excel files. The online access is here. http://www.palgraveconnect.com/pc/doifinder/10.1057/9781137305688
|
|
|
|
|
| My citatation for a single series:
|
|
|
|
|
| DATA Annual data on 'Share of women employed in the nonagricultural sector (% of total nonagricultural employment)' [by country] is available in the World Development Indicators (WDI) published by the World Bank (here).
|
|
|
|
|
| DATA Annual data on 'Labor participation rate, female (% of female population ages 15+)' [by country] is available in the World Development Indicators (WDI) published by the World Bank (here).
|
|
|
|
|
| DATA Annual data on 'Labor participation rate, male (% of male population ages 15+)' [by country] is available in the World Development Indicators (WDI) published by the World Bank (here).
|
|
|
|
|
| DATA Annual data on 'Labor participation rate, total (% of total population ages 15+)' [by country] is available in the World Development Indicators (WDI) published by the World Bank (here).
|
|
|
|
|
| DATA Annual data on 'Share of women employed in the nonagricultural sector (% of total nonagricultural employment)' [by country] is available in the World Development Indicators (WDI) published by the World Bank (here).
|
|
|
|
|
| – – – – – – – – – – – – – – – – – – – – – – – – – – – – – – – – – – – – – – – – – – – – – – – – – – – – – – – – –
|
|
|
|
|